WiseMage
HomeAboutWhat we doProjectsPartnershipContact
Message on WhatsApp
← Projects SaaS · Fashion retail · System with AI

OTB SaaS with AI

An Open-To-Buy planning SaaS for fashion retail: it turns the operation's data into a calculated buying matrix, a diagnosis and an action plan — the numbers from a deterministic engine, the reading and prioritization from AI.
OTB planning
8 weeks
intelligence
AI + deterministic engine
data
ERP + spreadsheets
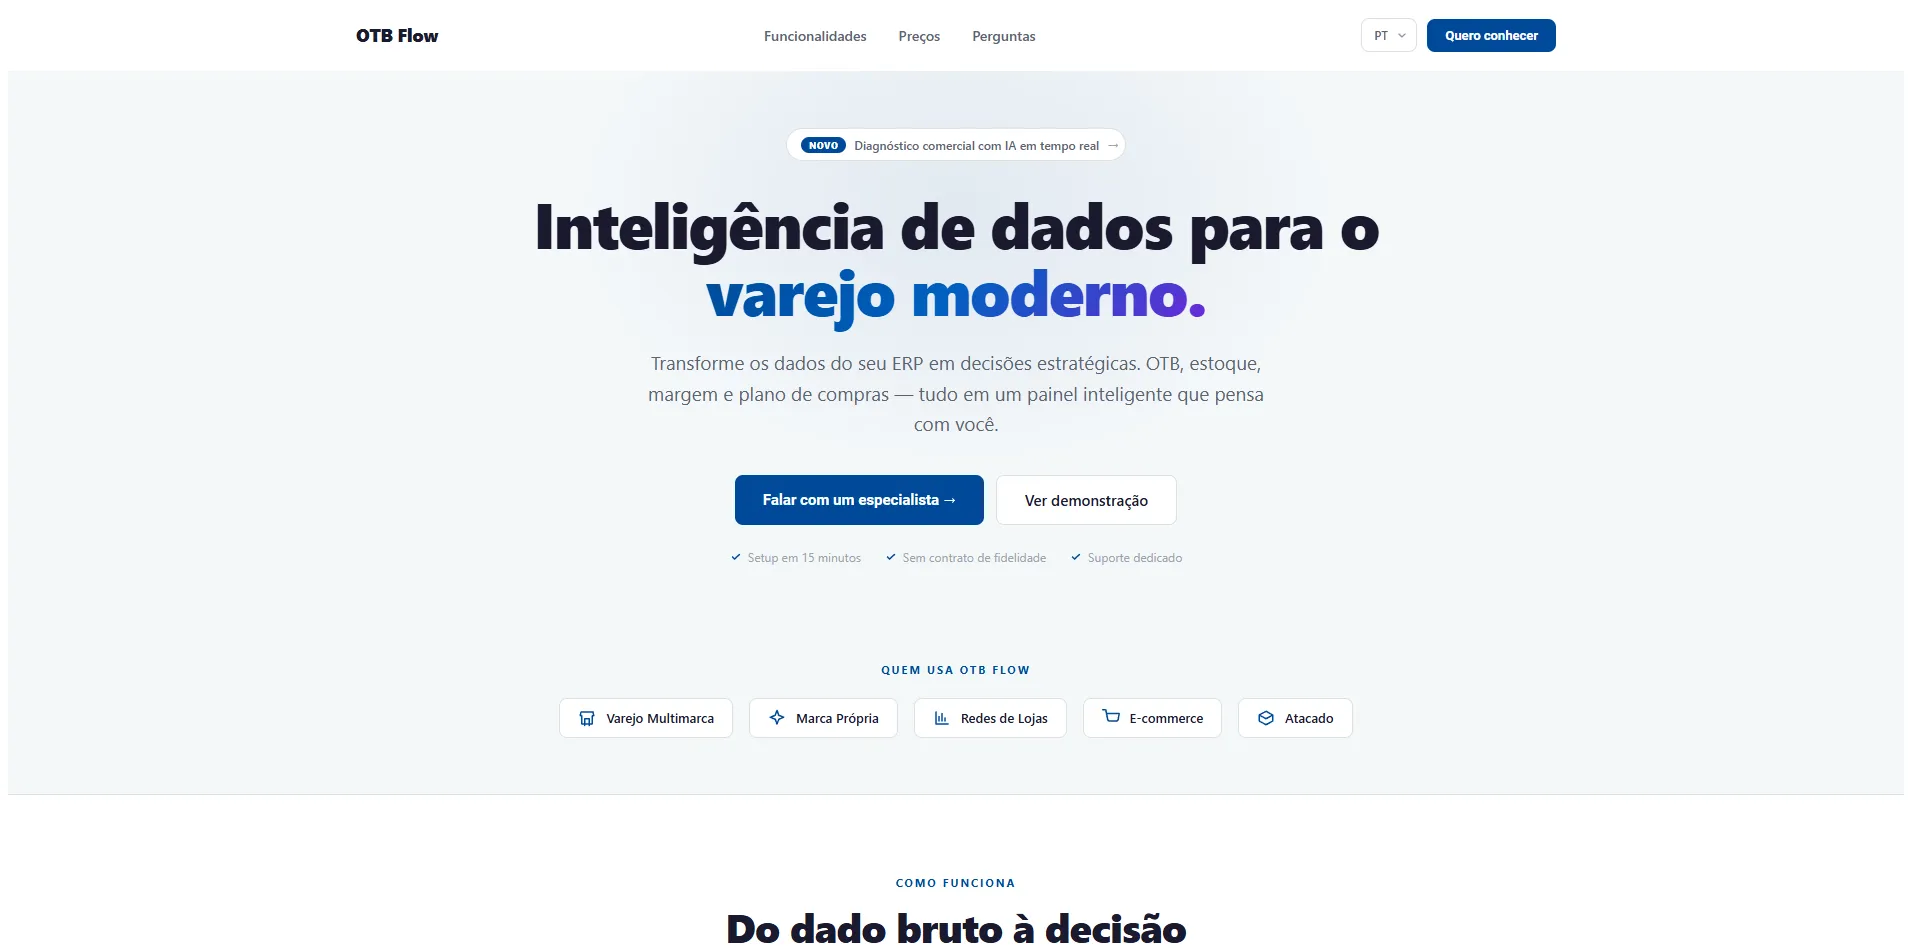
OTB Flow · Landing
OTB Flow landing page with the headline 'Data intelligence for modern retail' and the retail segments that use the platform
01  Context

In fashion retail, buying well means deciding how much to buy, of what and for when — balancing projected sales, current stock, receipts still on the way and a safety margin, category by category and week by week. That is the Open-To-Buy calculation: the amount left to spend without overstocking. And it's a moving target, shaped by seasonality, margin, coverage, history and the operation's commercial calendar.

OTB Flow, a system built by WiseMage, was made to own that decision. It starts from the data the operation already produces and turns it into a single structure for analysis: what to buy, what is piling up and where the operation is exposed — instead of a spreadsheet each person reads their own way.

02  The problem

The data exists, but scattered: it leaves the ERP in one shape, gets patched together in a spreadsheet, and each category ends up calculated its own way. Without a consistent base, OTB becomes a manual estimate, reading stock and coverage depends on whoever built the tab, and there's no way to compare store with store or period with period.

The real problem isn't the spreadsheet itself — it's turning what the operation generates into something reliable: normalizing the data, calculating OTB by the same rule every time, seeing overstock and stockouts, pointing to what to buy, what to liquidate and what to redistribute, and turning that into actions you can track. That whole path was what was missing.

03  What we built

OTB Flow is a multi-tenant SaaS platform built from scratch: each operation runs with its own isolated analytics database, and the flow goes from data entry all the way to the tracked action. It starts at import — the spreadsheet exported from the ERP is read, its columns are mapped to the system's model with AI assistance, then validated and normalized before any calculation.

From there, the calculating is done by a deterministic engine. The OTB matrix — sales projection, stock rolling week by week, coverage and the buying amount per category and period — is the single source of the numbers. AI comes in afterwards, on top of those already-calculated numbers, to read the scenario, prioritize and write the diagnosis and the action plan. The numbers are the system's; the reading and the prioritization are the AI's.
AI-assisted import
The input is the spreadsheet exported from the ERP — with multiple sheets included. AI maps each column to the internal model, and the system validates and normalizes the data (fabric, SKU, categories) before writing it. Mappings are saved and reused in the next import. Direct ERP integration can also be built case by case, according to each client's environment.
Deterministic OTB engine
The heart of the system. The OTB matrix is calculated by a versioned engine, not by a spreadsheet sum: sales projection by moving average, a commercial factor per week (Mother's Day, Christmas), stock accrued week by week and a sliding window that yields the amount available to buy per category and period. It is the single source of the numbers — coverage, stockouts and overstock all come from there.
AI diagnosis and action plan
On top of the already-calculated numbers, an AI pipeline runs seventeen queries against the database, consolidates the scenario and generates the plan across six fronts — SWOT, overview, stores, categories, where to invest and the actions. The recommendations are concrete: buy, liquidate or redistribute, by subcategory and by month. The AI narrates and prioritizes; the values still come from the deterministic engine, with safeguards that block invented numbers.
Tracking board
The plan doesn't die in a report: it becomes a kanban-style board, with the actions organized, an owner per item and sharing by link. What was diagnosed starts being tracked.
Operation dashboards
Beyond OTB, the system delivers the dashboards that support the decision: sales, stock, margin, markup, discount and average coverage, stock aging, plus cuts by store, by category and by supplier, with the future order book and delivery lead times.
Multi-tenant SaaS architecture
Each client runs isolated, with its own analytics database, and the system controls access by user and sub-user, data history and versioning, and recurring billing with a limit by operation size. It is the structure that lets the same product serve different operations without mixing them.
04  Evidence
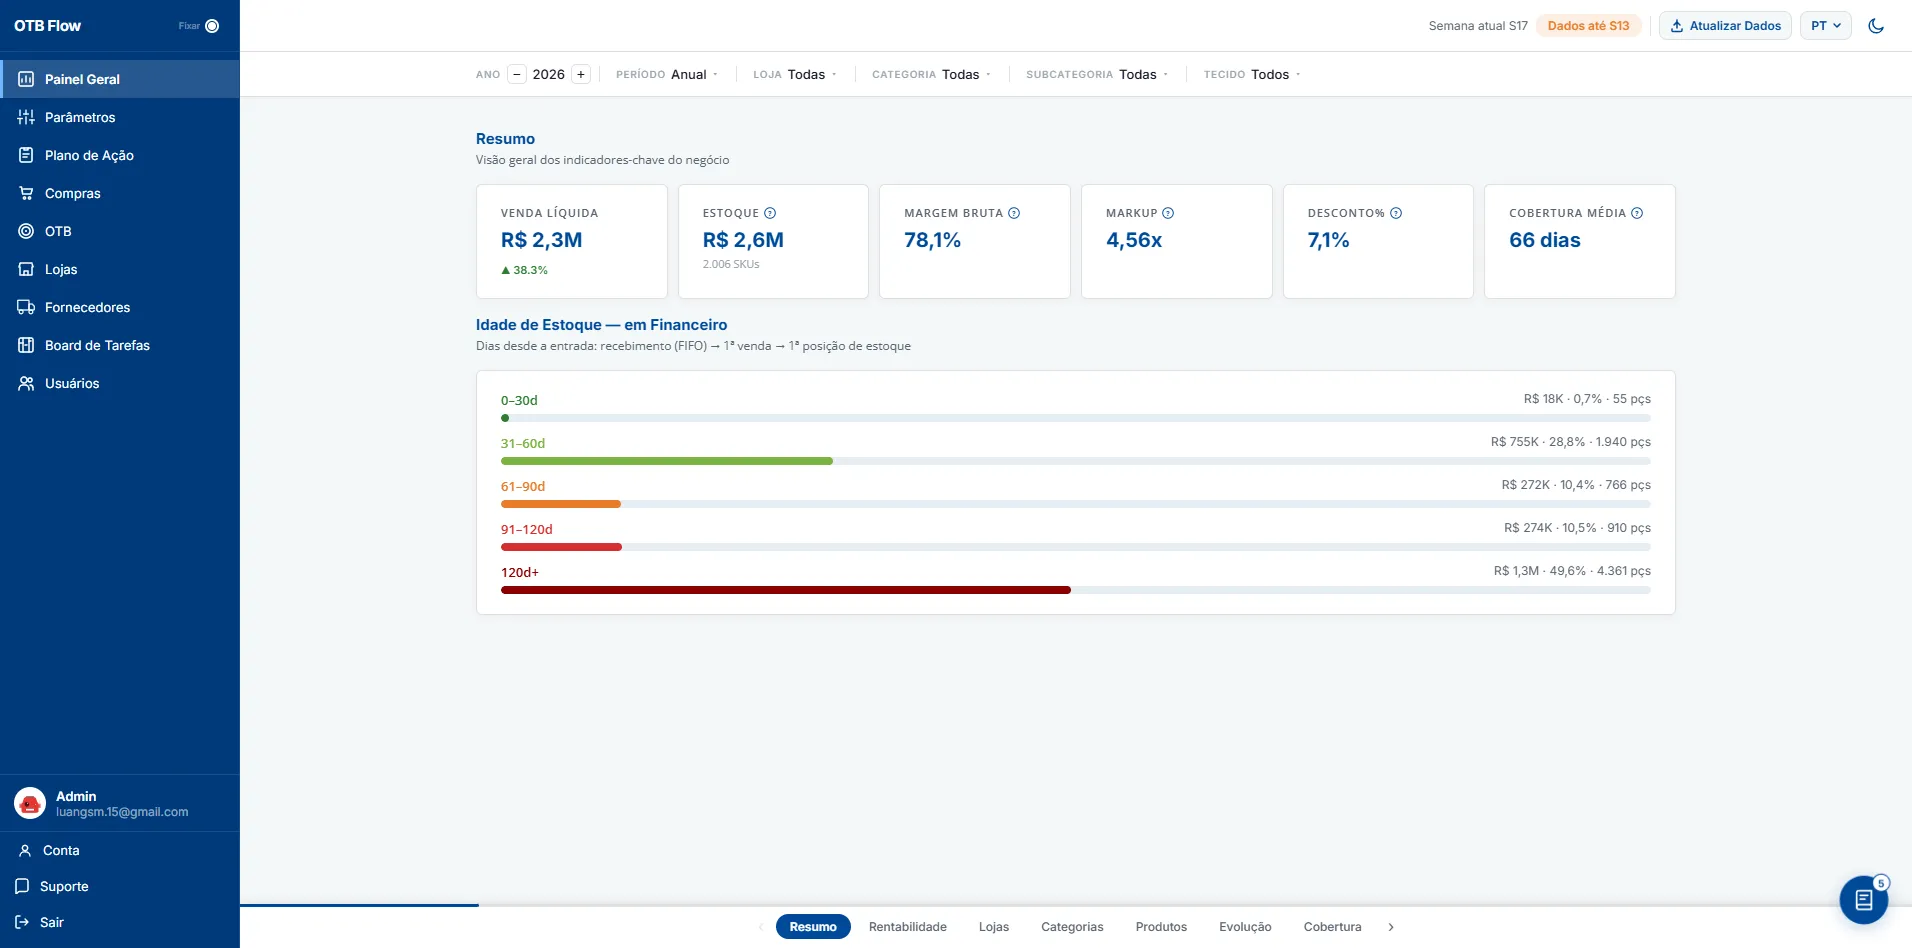
General Dashboard
General dashboard with the key indicators — net sales, stock, margin, markup, discount and coverage — and stock aging by band
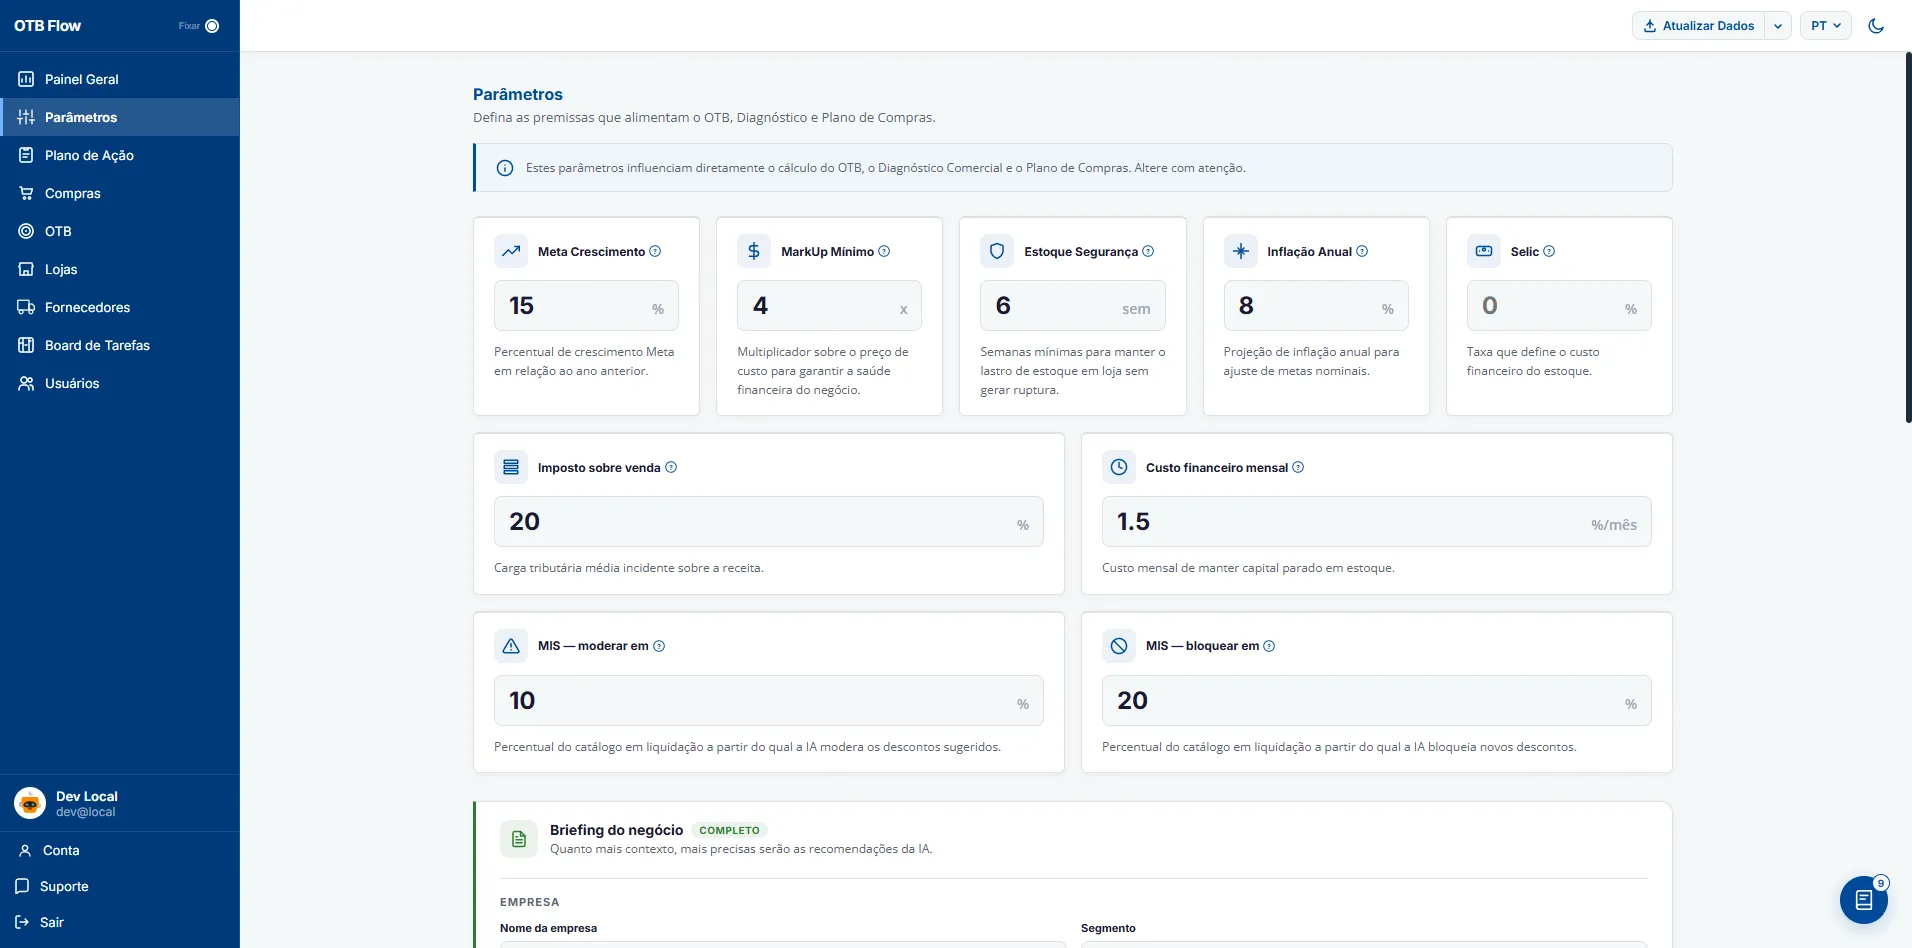
Parameters
Parameters screen with the assumptions that feed the calculation — growth target, minimum markup, safety stock, inflation and the business briefing
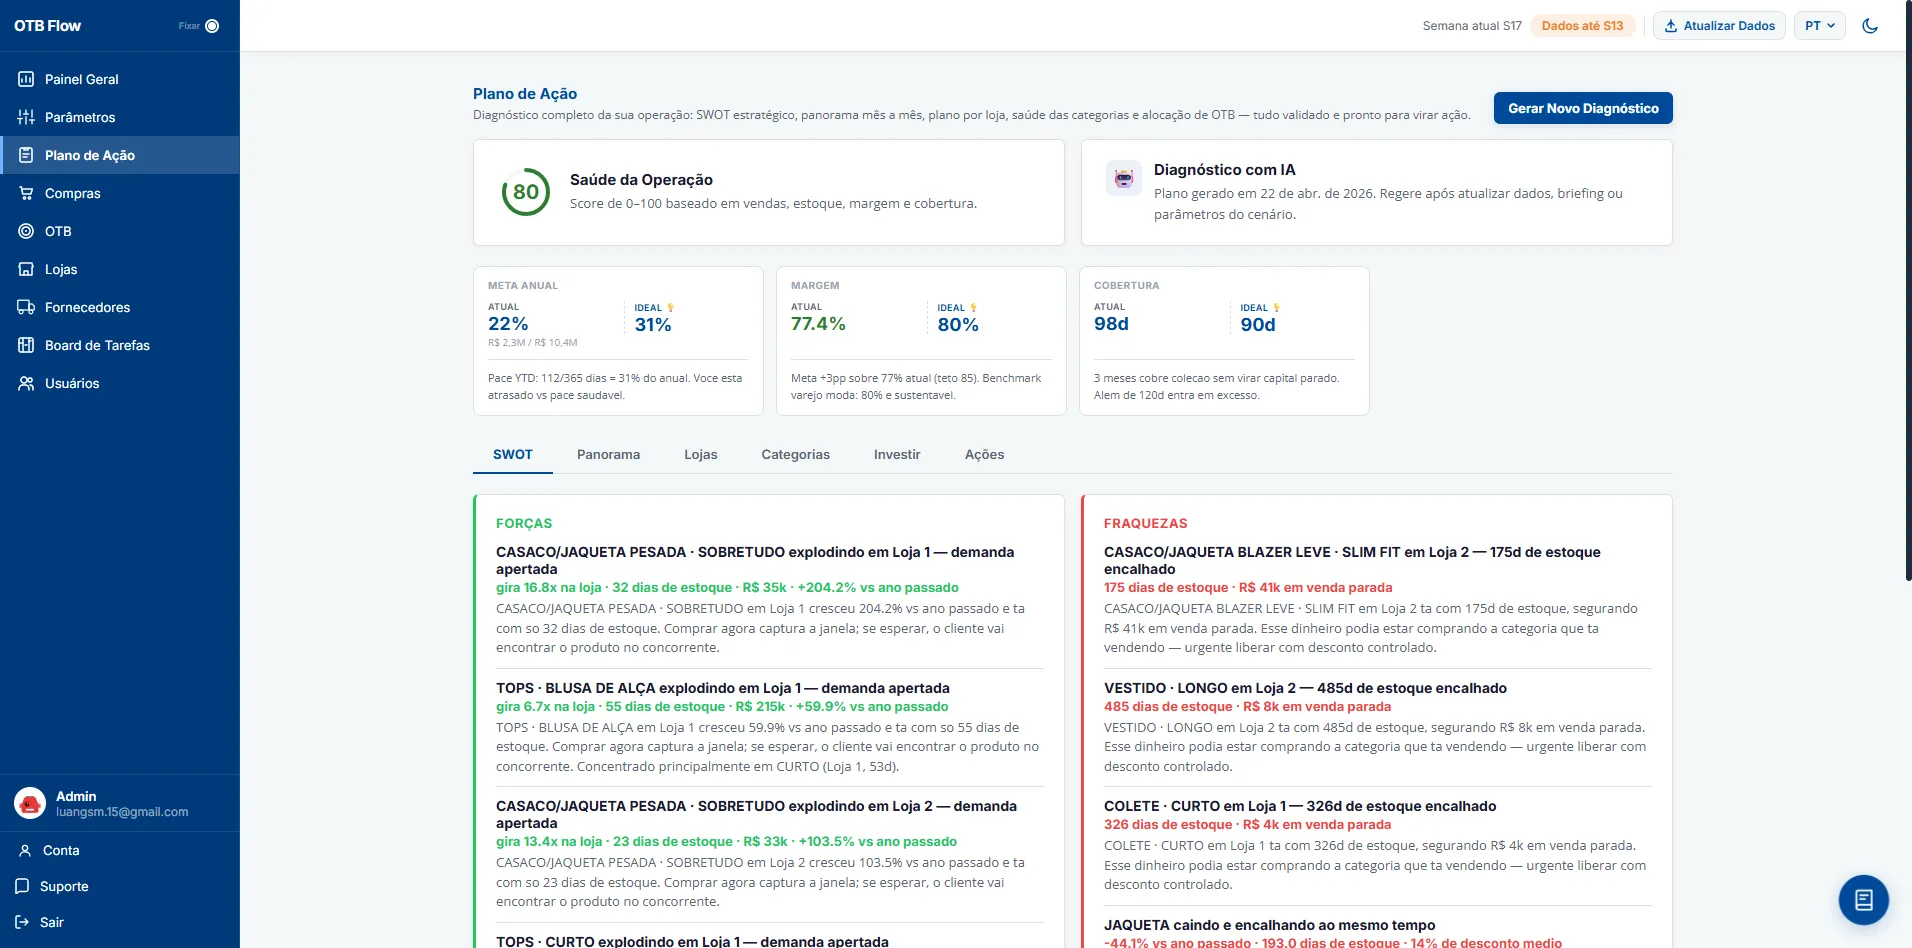
Action Plan
Action plan with an operation health score, an AI diagnosis and the SWOT analysis of strengths and weaknesses
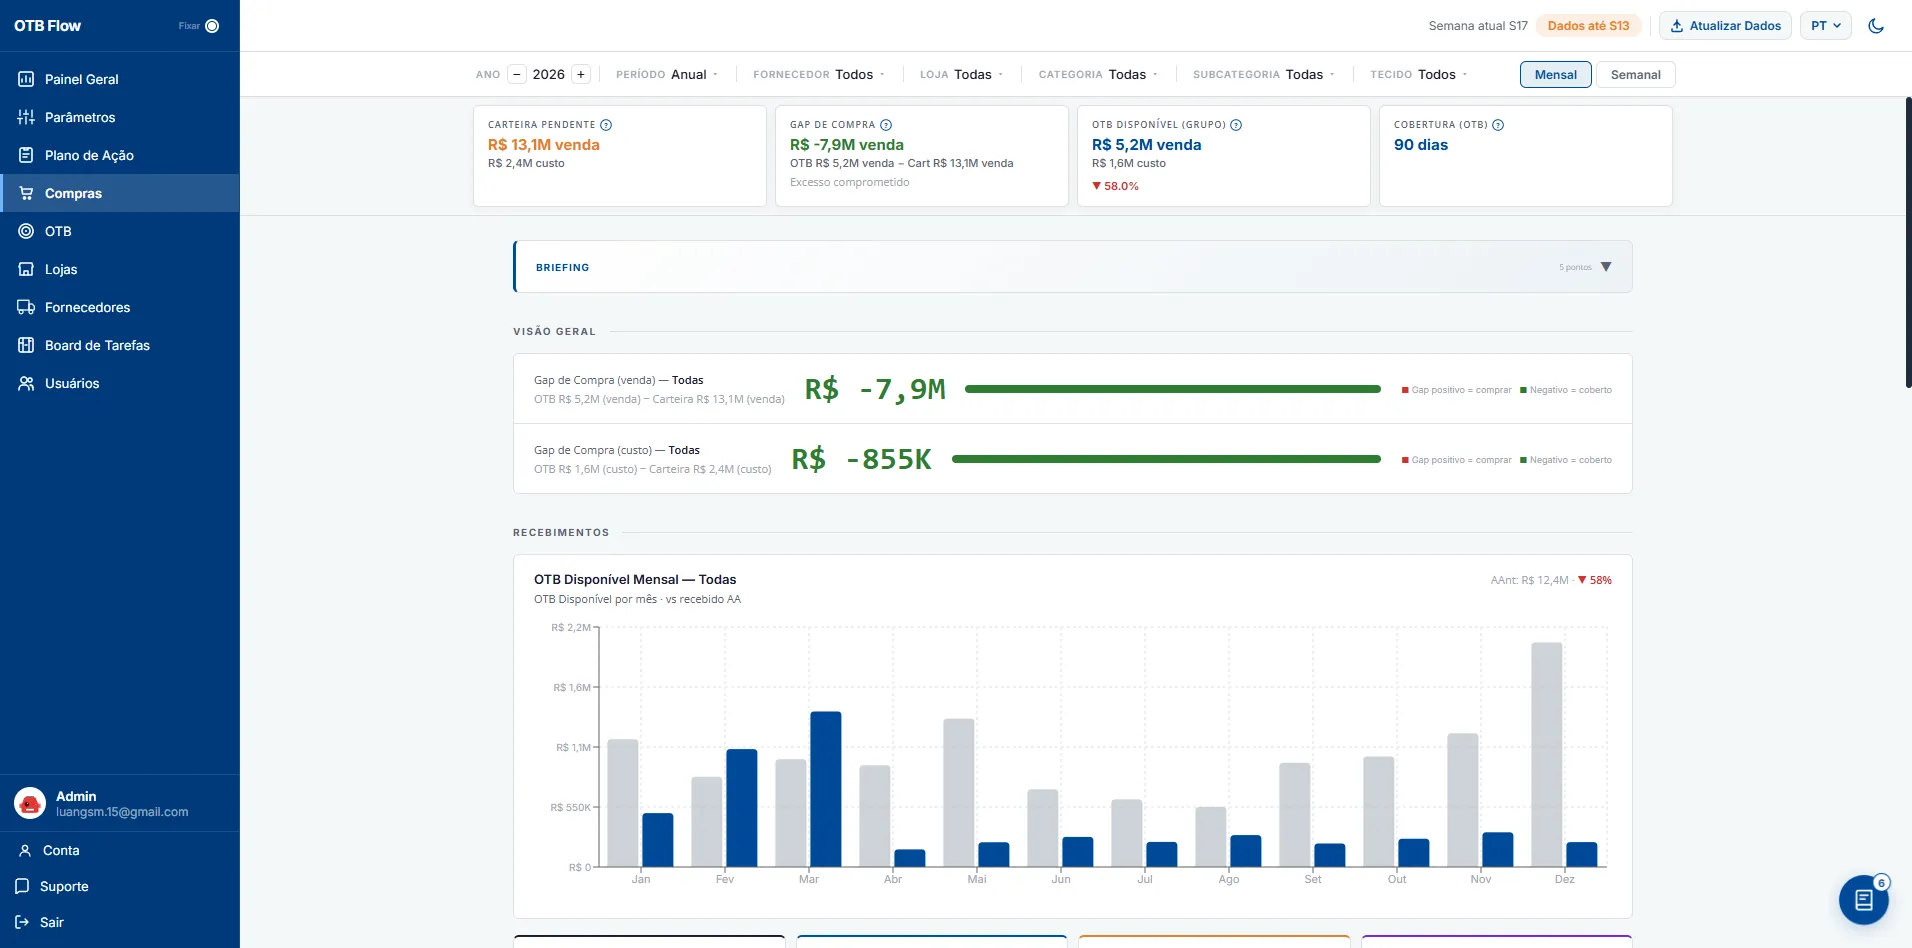
Purchasing
Purchase plan with pending order book, buying gap, available OTB and the monthly buying projection versus received
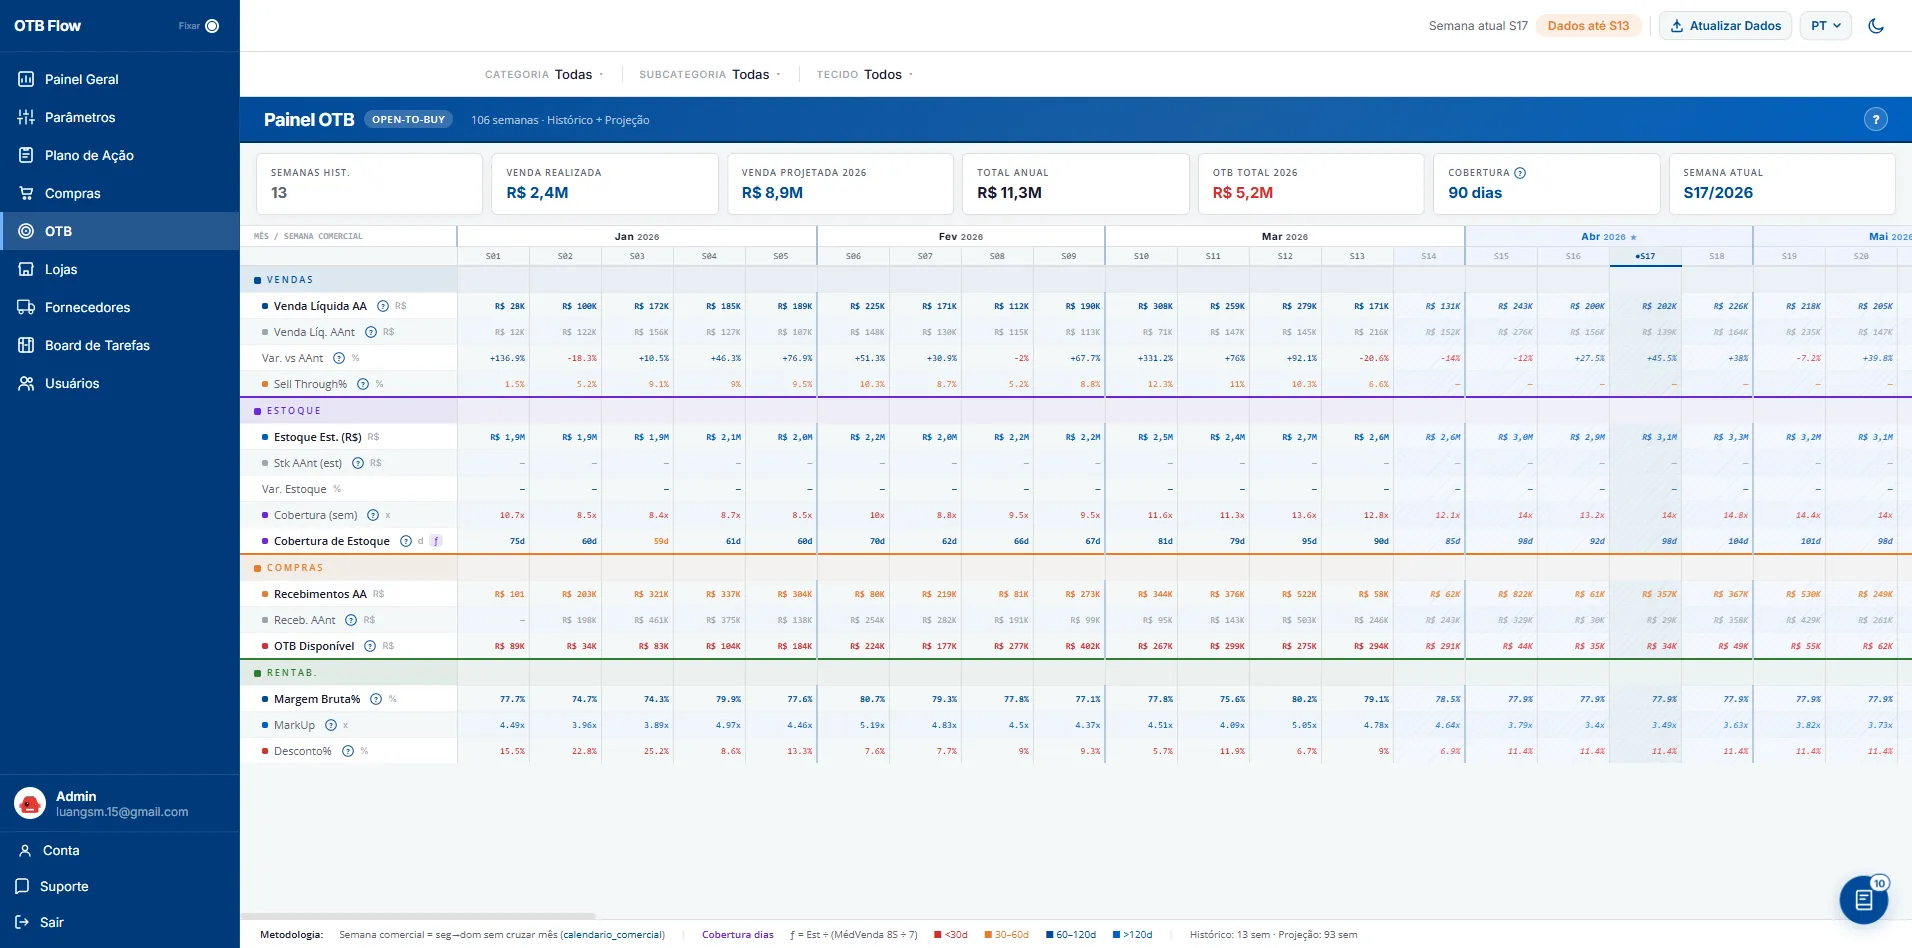
OTB Matrix
Week-by-week Open-To-Buy matrix, with projected sales, stock, coverage, receipts and the available OTB per period
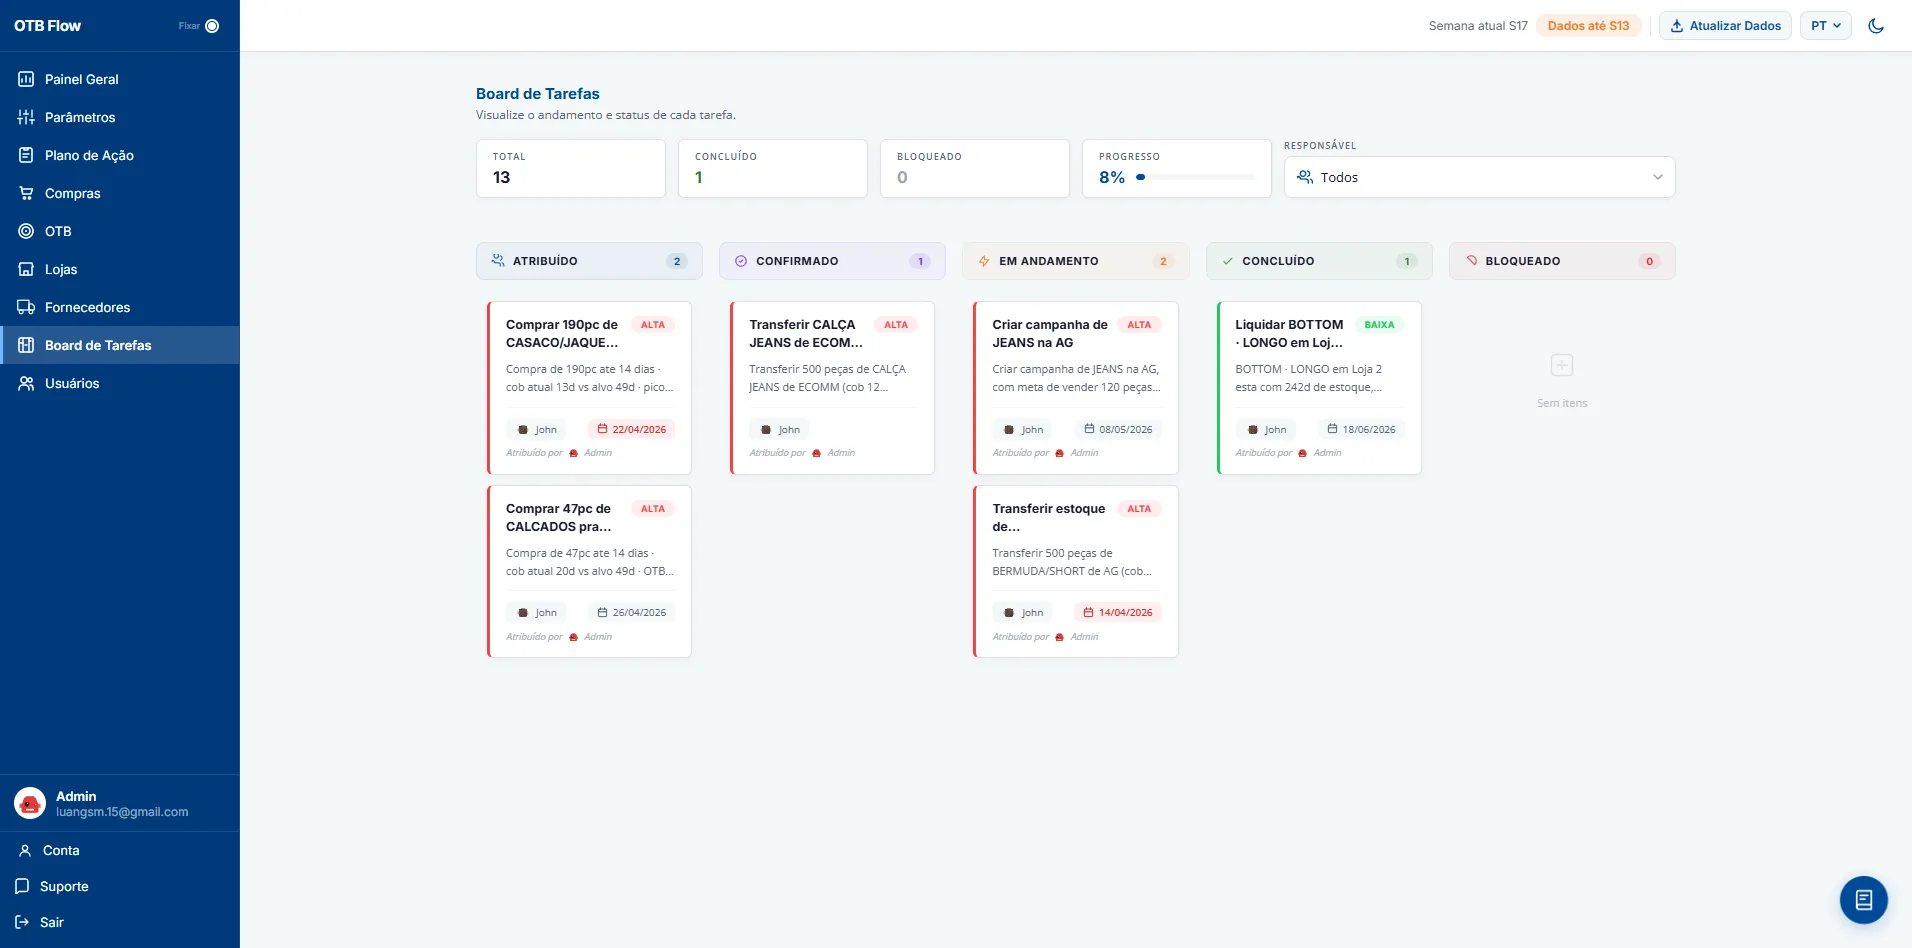
Task Board
Kanban task board with buying, transfer and liquidation actions distributed by status and owner
Stack
Front-end
React SPA with Vite, charts in Recharts and a drag-and-drop kanban; three languages (PT/EN/ES).
Back-end
FastAPI with dozens of routes, JWT authentication, paywall and async processing for import and AI.
Data
One isolated DuckDB analytics database per client for the calculation; Postgres (Neon) for account, access and billing.
AI & integrations
AI via Groq in mapping and in the plan; billing via Asaas; macro context from weather, exchange rates and economic indices.

System captures with demonstration data.

05  Impact

The gain isn't a sales figure — it's the whole path in one place. The operation's raw data comes in, gets normalized and calculated by the same rule, OTB stops being a manual estimate, and analysis becomes diagnosis, priority and a trackable action. What used to mean building a spreadsheet and eyeballing it now comes out structured, comparable across stores and periods, and ready to become a buying, liquidation and redistribution decision.